
The Government plans to fix the housing shortage by imposing annual housebuilding targets on local authorities in England – initially by tweaking the current Standard Method, but then later going on to more directly set targets nationally. These would need to take account of environmental constraints such as National Parks. I’ve taken a look at how this could be done.

The current system decides how many homes each local council needs to allow by taking the local housing number from the Standard Method formula, then letting the local plan process adjust it for local constraints such as protected landscapes. That’s fine in theory, but in practice it means most councils adjust downward, with little incentive for neighbouring authorities to take up the slack. The result is a continuing national shortfall, way below the Government’s aim of 300,000 new homes a year.
The White Paper suggests these adjustments might be baked into the numbers from the start, so no further local changes would be needed (or allowed). That puts a lot of pressure on the formula (don’t say “algorithm”!) to get it right.
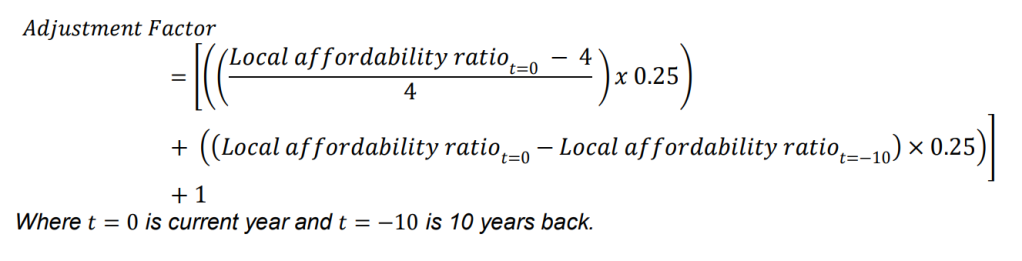
The White Paper doesn’t say what the formula will be, but the separate consultation on shorter-term changes gives us an idea what the government may be thinking. In this, the baseline is the higher of either the ONS household growth forecasts, or 0.5% annual growth in existing housing stock. That’s then adjusted for affordability using this formula.
I’ve written previously about some of the issues with that will need fixing with this new proposal. Many result from the very strong weighting given to local unaffordability of housing, which is rightly intended to get homes built where they’re needed most, but:
- It pushes an unrealistic amount of housebuilding into London (nearly a third of England’s total). Housing targets led by affordability signals are clearly a good starting point in economic terms, but not to the point where it becomes undeliverable.
- It could actually reduce housebuilding for much of northern England – which will make hitting 300,000 a year even harder
- Away from the southeast it pushes housing numbers out of cities and into their more affluent surrounding catchments – contrary to the “brownfield first” aims of the White Paper
- And finally, it assumes much of England’s housing target will be met in districts that are heavily constrained by important environmental protections.
Tweaking the formula to fix one of these tends to make one of the other problems worse. Can we improve on all four measures at once? Here’s a first attempt, based on tweaking the consultation proposals:
- Increase the “stock” adjustment from 0.5% to 0.8%, to ensure major cities outside the southeast contribute more
- Remove the second of the two “affordability” adjustments (rate of growth of affordability) to avoid pushing too much into London
- Replace it with an equivalent up/down adjustment for authorities with less/more than the average environmentally-protected land.
The point here is to make sure that we do not to simply reduce the local targets according to environmental constraints, but actually redistribute them, so the national total doesn’t fall short of the 300,000 target.
That adjustment formula could then look like this:

Where local and national constraints are the proportion of protected land, which could include:
- AONB, National Parks
- SSSI, SAC, SPA*, Ramsar
- Heritage Coast, World Heritage Sites
That adds up to 26% of England. Other constraints could potentially be added, such as flood zones or nature reserves. I’ve deliberately not included Green Belt, as that’s not an environmental designation, it’s a policy decision to stop urban growth. We can move green belt boundaries if we need to. And we need to.
So what would these changes do to the numbers? It’s by no-means perfect, but it’s a significantly more realistic starting position, as the figures below show.

There will always be inconsistencies when a fixed formula is applied locally, including what’s becoming known, rather brutally, as “the Barrow-in-Furness question”. That is, how to apply housebuilding targets to areas with falling population and low house prices? I doubt a perfect formula is possible, and some system for agreeing local re-distribution of targets between councils will be needed. But that system will work best if the formula gets closer to a workable answer in the first place.
So what does the tweaking proposed above actually do locally? The map below has blobs proportional in size to the housing target. And each is coloured green in proportion to the percentage of environmentally protected land in the district.
The “unadjusted” figures are as proposed in the Government’s current consultation, and the “adjusted” version shows the effect of the changed formula above, taking account of environmental constraints. You can see how much housing the current proposals push into London and into the many constrained districts in the South.
The GIF shows the suggested adjustment reduces both to more realistic levels, while ensuring cities in the Midlands and North contribute more too.

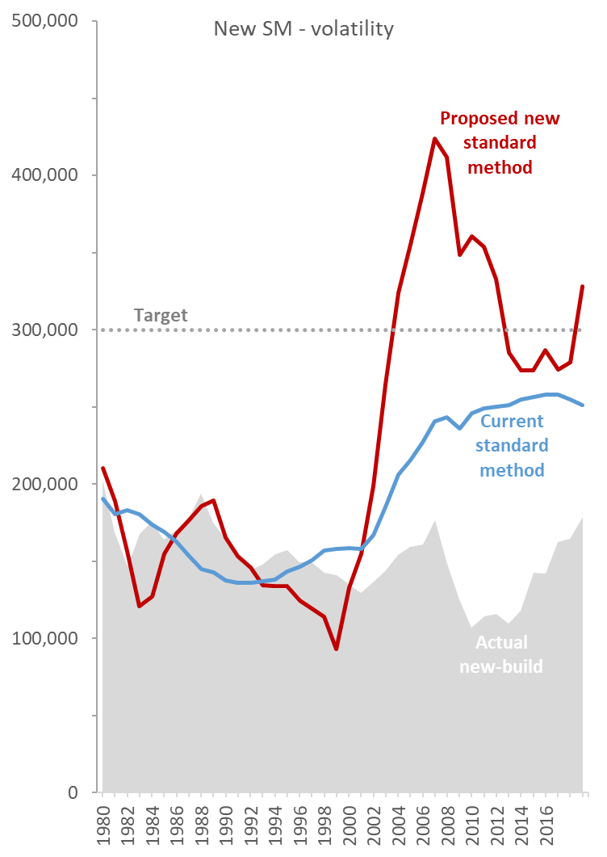
Another benefit of putting a little more emphasis on stock growth is that it would reduce the volatility of the numbers over time. Affordability ratios can change rapidly if the housing market hits a downturn (for those of us old enough to remember that house prices can go down as well as up).
I’ve had a go at backfitting the current standard methdology, and the Government’s proposed new forumula to historical data for England in the chart below (making a heap of approximations along the way…). This isn’t an exact representation, as applying it nationally will give different results to the sum of each district, but it does illustrate the potential for wild swings in the numbers if we stick to the consultation proposals for an uncapped double adjustment for affordability. An effective formula for allocating housing need is going to have to be stable enough not to dramatically shift the numbers up and down year by year.
In the long term prices may be a useful indication of housing need, but in the short term they may tell us more about the state of the economy or interest rates. And yes, the difference between “need” and “demand” in housing is a whole other debate, and one to save for another post!
* Area of Outstanding Natural Beauty, Site of Special Scientific Interest, Special Area of Conservation, Special Protection Area


Interesting but the tweaking of an algorithm just gets complicated. Why not as I have suggested on behalf of a group I represent simply taking NPs, AONBs and Ramsars out of the target and leaving planning decisions for those areas down to the LPA?
Submission to MHCLG re Changes to the Planning System White Paper
We wish to comment on these proposals on behalf of the Rother Neighbourhood Plan Forum. This group was established over three years ago and is made up of representatives from those communities in Rother who have made, are making or are thinking of making Neighbourhood Plans within the Rother LPA. It meets on a regular basis to talk, offer mutual advice and encouragement on the matter of Neighbourhood Plans and is addressed at each meeting by planners and other experts in this field.
In this response we will solely deal with the section of the White Paper concerned with changes to the current standard method for assessing local housing need.
Para 4: It is a concern that the thrust of these proposals is designed specifically to meet the ‘Government’s aspiration for the housing market’; in other words, the figures resulting from the proposed algorithm are obliged to add up nationally to 300000+ homes per annum.
Para. 6: This paragraph seems to ignore in its argument for a target of 300000 homes p.a. the implications of the figures quoted there. Adopted local plans provide for an annual rate of home building of 187000 units, but in 2019, 241000 units were actually built, a 29% out-performance. So why set the new target for 300000 units, given housebuilders’ actual performance and therefore their ability to deliver substantially in excess of any given target?
Para 7: Here the proposals fail to take into consideration the number of unimplemented planning permissions. There are currently in excess of one million such permissions nationally.
If you are to set a new target for an LPA, in finalising such target, you must reduce that target by the number of unimplemented permissions in that LPA. Would it not therefore be more sensible to create policies to ensure developers build out the current permissions they already have in their land banks?
Setting a target for 15 years hence does not take account of the possibilities of development on any brownfield land that will come available during that period, so forcing more greenfield land to be prematurely allocated in the Local Plan.
Para 10: This paragraph underlines that this process is aimed to implement a Government manifesto commitment regarding future housebuilding and that the figure of 300,000 is arbitrary and not based on an accurate or realistic housing needs projection.
Para 15: The Government here acknowledges support from experts who have a known background in acting for development clients: it is of serious concern that the Government seems not to have sought prior input on the development of the proposed changes from heritage and environmental interests as well as from each tier of local government, each of whom play a significant role in the operation of the current planning system, so that a formula or approach could be created to take into account all appropriate factors? In short it appears to have been a formula generated for the benefit of developers who have an interest in seeing targets pitched as high as possible.
Para 17: Where in these aims is that of achieving a greater number of affordable homes available either to rent or part purchase? Our findings through the surveys that we all have had to produce for our Neighbourhood Plans indicated that the requirement for affordable homes of all tenures is the key local housing need in rural areas. There is nothing here which would provide more granular targets to achieve this desired aim. Indeed another thrust of this White Paper, the proposals for supporting small and medium-sized builders, would threaten the already low number of affordable houses to be built, by raising the threshold for the requirement for affordable homes on a development from 10 to 40 or 50.
Why does the Government persist in its thinking that housebuilders will build more homes, when all the evidence is that they will not build more homes if the market means they have to reduce prices?
Paras 23- 39: We do not agree with the algorithm proposed for the following reasons:
a) 0.5% of the existing stock of housing could vary dramatically from LPA to LPA and therefore serves as a most unreliable marker for the calculation of housing projections.
b) The so-called affordability adjustment has the effect of producing the largest increase in housing provision in LPAs where existing housing is more expensive. Looking at the figures for Rother, the new formula would mean an increase in the annual homes requirement to 1173, an increase of 59% over the 2018 methodology at 737 and a current Local Plan target of 335, a figure which has not been achieved over the last few years not through lack of permissions granted but because of land owner and developer land banking.
c) Taking Rother as an example, should the Government not consider investigating any specific reasons why this might be the case? There could be infrastructure issues, or it could be because the wages rates for Rother-based jobs are different to wage rates enjoyed by Rother residents. It also could be that there is a substantial market in second homes in certain areas of Rother. Unless these and any other factors are considered, the imposition of a rigid algorithm will produce an unrealistic and simply unachievable target..
d) One very specific reason why there is a lower than expected level of housebuilding is the fact that 82+% of Rother’s land area is comprised within the High Weald Area of Outstanding Natural Beauty, whilst another 7% is covered by Ramsar designations. Rother planners in the past have been reasonably successful in ‘conserving and enhancing’ the AONB even before the publication of para 172 of the NPPF which says ’Great weight should be given to conserving and enhancing landscape and scenic beauty in….Areas of Outstanding Natural Beauty, which have the highest status in relation to these issues.’
e) The difference in the practical working out of the algorithm becomes very dramatic if you compare Rother with its immediate neighbour, Hastings. Both have roughly similar current populations (mid 90000s) and arguably Hastings is still in need of regeneration. Indeed at the time of drafting this submission, this has been recognised by Hastings having been awarded £2 million of specifically regeneration monies under the High Streets Heritage Action Zone scheme.
Hastings under the 2018 Standard Method has a target of 450 new homes p.a. and under the new calculation, this figure would decrease to 394, a drop of 15%, compared with an increase of 59% for Rother, which entirely surrounds Hastings. It seems perverse that an unthinking application of the algorithm produces such absurd results.
f) So the outcome for Rother of an imposition of this algorithm would be to legitimise the development of more high priced market-led housing on greenfield sites, almost all of which will inevitably come within the High Weald Area of Outstanding Natural Beauty or other important environmentally designated areas.
Conclusion
The proposed changes pay no attention in their operation to the character and beauty of the English countryside and more particularly as far as Rother is concerned, the predominance therein of the High Weald Area of Outstanding Natural Beauty. The algorithm must not be used in such circumstances in order to dictate a top down housing target oblivious of its consequences.
Given the relative size of land covered throughout England by the AONB designation and the number of houses that would be imposed on such areas (approx. 35000) by a rigid application of the algorithm, it would seem perfectly feasible for all areas covered by AONB designations (including the 82+% of Rother’s total area) to be exempted from the imposition of the algorithm, in the same way as under current legislation are National Parks.
This does not mean there will be a moratorium on all housing development within Rother’s AONB, which would indeed be potentially atrophying, but the LPA should be left itself to ascertain what numbers and types of development would be appropriate in whichever location, to be consonant with the history, heritage, beauty and special environment of the High Weald AONB.
30.09.2020